
The critical role of earnings surprise in equity markets and factor investing
- 25 June 2024 (10 min read)
US investor and professor Benjamin Graham once famously said: “In the short run the stock market is a voting machine but in the long run it is a weighing machine”.
Certainly, sentiment can be a powerful driver of short-term stock market returns. But ultimately what truly matters over the long term - what actually gets weighed - are fundamentals such as book value, cash flow – and specifically, earnings.
It’s right to focus on company earnings of course but the level of delivered earnings growth is less important to the market than any actual surprise in growth - the amount by which a company surpasses, or disappoints, relative to expectations.
Fundamentally, we strongly believe in the importance of earnings surprises – analysis of which can help explain stock returns and as such it is a vital area which investors should pay attention to.
What is earnings surprise?
Brokers hire a great many analysts to write and publish detailed corporate earnings forecasts. These individual forecasts are combined to create consensus estimates on what a company is expected to earn – usually over the coming 12 months.
Compare this forecast to the level of earnings a company subsequently delivers, and the difference is the delivered earnings surprise.
In the exhibit below, we look at how these measures of earnings growth and earnings surprise relate to a specific stock, in this case Apple. We can see analysts have consistently expected the technology giant to deliver earnings growth (left hand chart) and that the company has also consistently delivered growth higher than those expectations.
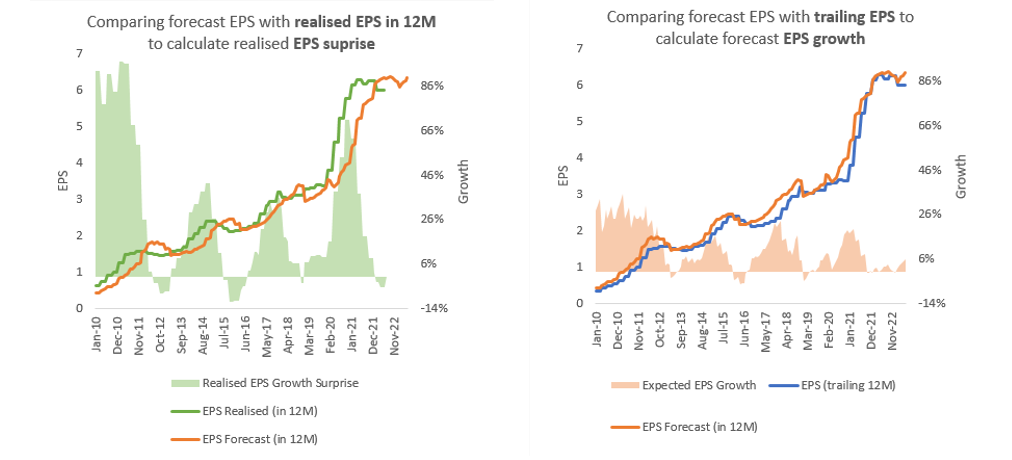
Source: AXA IM
In the exhibit below, we show two measures of growth for the overall global market - realised earnings growth and earnings surprise. The key takeaway from the chart is that, on average, the market in aggregate has delivered negative earnings surprise.
A way of interpreting this observation is that the consensus expectation of future growth is too optimistic - on average when stocks report their earnings they disappoint (they deliver a negative earnings surprise) relative to expectations.
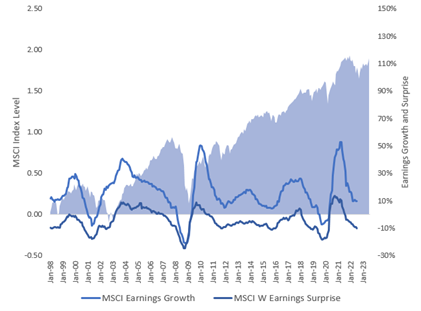
Source: AXA IM
If you could predict one thing, make it earnings surprise
It is vital for investors in equity markets to understand the relationship between returns and three measures of earnings growth: expected growth, realised growth and earnings growth surprise.
To make this assessment, we conduct a back-test. Each month we split the universe into five equally sized buckets, based on a measure of growth. We then measure the returns of stocks in that basket. By analysing the results of this back-test we can make an assessment of the measure to see if it can predict future returns.
The chart below shows expected growth is not predictive of future returns. This is a surprising result - companies with the highest level of expected growth have actually underperformed on average.
The next two measures utilise a so-called ‘perfect foresight’ technique. Perfect foresight refers to a hypothetical ability to make predictions with complete and accurate knowledge of all future outcomes; in this case it assumes we will know today the earnings per share (EPS) all companies will deliver in 12 months’ time. We use this technique to look ahead 12 months to rank companies on the level of realised growth they deliver in earnings and earnings surprise, then measure the hypothetical return if they had bought the stock today.
As expected, stocks which deliver very high growth are well rewarded, but names that deliver very high EPS growth surprise deliver even better returns. It is important to note that within the group of companies delivering high earnings surprise, there exists a wide range of delivered earnings growth. It includes companies that deliver low levels of earnings growth. As such, if we could predict only one thing it should be earnings surprise.
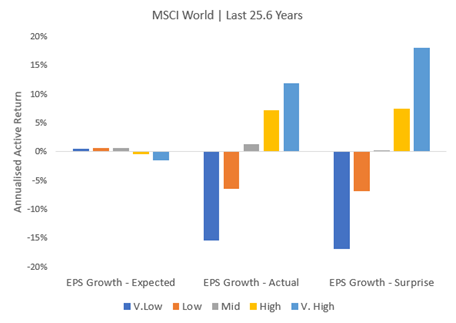
Source: AXA IM
The interaction of earnings growth and earnings surprise
The chart above makes it clear how the market rewards realised surprise more than realised growth. But what happens when we look at the relationship between realised growth and realised surprise? The table below shows the annualised excess return of combinations of realised earnings surprise and realised earnings growth. Perhaps unsurprisingly, the best rewarded segment of the market is those stocks that deliver very high growth and very high surprise.
But what is more interesting is the observation that companies that deliver very low earnings growth, but beat expectations, (bottom right quadrant) outperform.
In the opposite side of the grid, companies that deliver very high growth, but are below expectations, will underperform the market. Earnings surprise is consistently rewarded by the market, but earnings growth is not.
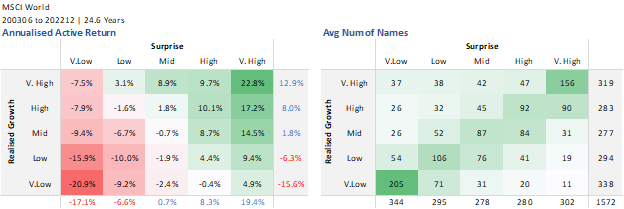
Source: AXA IM
Expected growth and realised surprise from a sector perspective
Another important observation can be made when we look at growth and surprise by industry. We can see that technology has consistently had high expectations of earnings growth relative to the overall market, and that consumer staples stocks have lower levels of growth.
What is important to note is that earnings surprise exists - and is well distributed - across all sectors. This observation makes the case for building well-diversified equity portfolios that have exposure to all market sectors. An investor looking to capture pure growth may need to have more industry concentration but an investor looking for earnings surprise needs diversification.
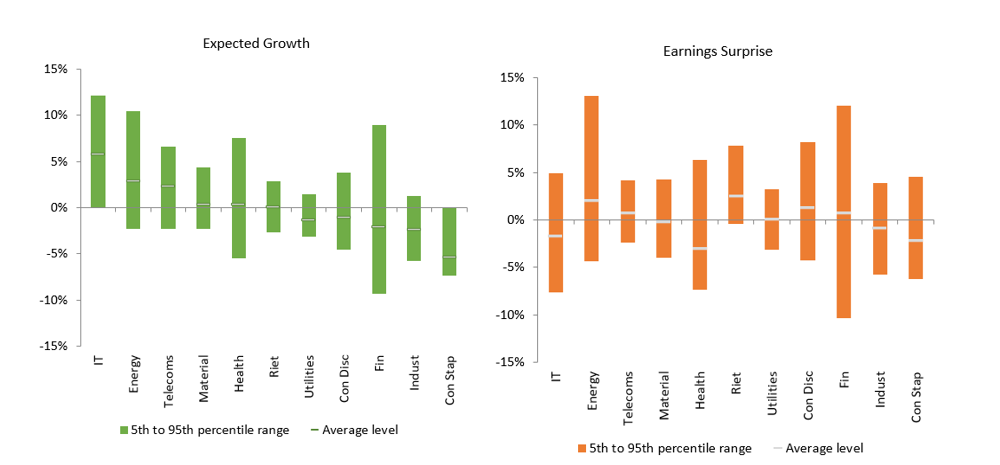
Source: AXA IM
What does earnings surprise mean to a factor investor?
Many investors take a ‘factor’ approach to investing – and we believe that earnings surprise is an often-overlooked part of factor investing that can have an important impact on investor returns.
Factor investing is a way of identifying and classifying the common characteristics of companies that have delivered certain patterns of return. These patterns can potentially provide insight into how stocks could be expected to perform in the future – and we believe a factor framework can play an important part of an equity investor’s approach.
Some of the most common and widely used factors by investors are: Value, Quality, Growth, Momentum and Low Volatility – asset managers can create their own definitions and models of each one.
We broadly define factors as follows:
- Value: Companies with a stock price which is relatively inexpensive compared to fundamentals, such as price-to-earnings, price-to-book value and dividend.
- Quality: Companies which have attractive levels of profitability (such as return on equity). Quality measures can also incorporate balance sheet information and measure the stability of earnings delivery.
- Growth: Companies with high historical and/or expected levels of future sales or earnings growth, typically measured over a multi-year horizon.
- Momentum: Companies which have had a positive price change relative to the market, typically measured over the previous 12 months. Momentum factors can also incorporate changes in earnings expectations.
- Low Volatility: Companies with stock prices that are relatively less sensitive to market moves, i.e., their stock beta, and/or idiosyncratic risk is lower than the market.
The reason why some equity investors, particularly quantitative investors, pay attention to factors is because over the long term each has delivered a premium return to the overall market, albeit with different levels of risk.
The chart below shows the risk and return profile of the most attractive 20% of stocks in the MSCI World Index ranked by the standard or ‘simple’ factor definitions as well as our proprietary factor definition (EQI).
Taking the simple factors first (blue dots), we see that over the long term they all have a return premium associated with them. The chart also shows our proprietary factor definitions (yellow dots) have been able to deliver significant improvements in return while lowering risk.
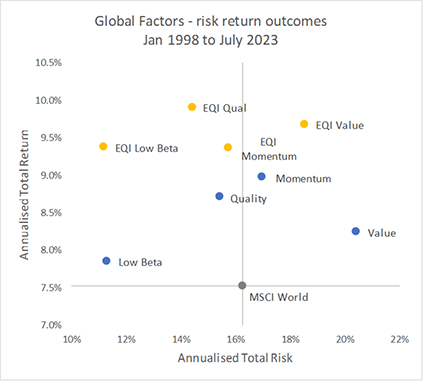
Source: AXA IM
We now look at simple and proprietary factor outcomes through the prism of earnings growth. There are several key takeaways from the exhibit below. Momentum is the only factor that delivers better earnings growth than the market. All simple factors deliver better earnings surprise.
An interesting point to note is our proprietary Value factor delivers better growth but less surprise than simple Value. Although earnings surprise plays an important part in explaining factor returns, it is not all-encompassing and is not the only dimension to consider when aiming to improve investment outcomes.
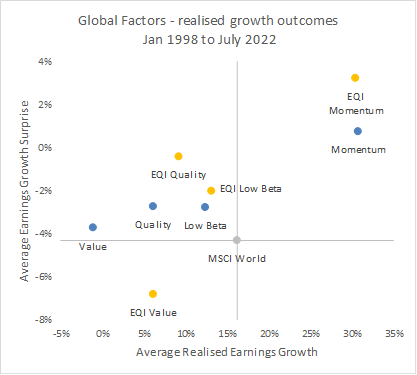
Source: AXA IM
Fundamentals drive returns
We believe the impact of earnings growth and surprise should be a strong consideration when designing stock selection models for any equity investor. This is something that should not be overlooked by factor investors, as regardless of industry sector, all factors have the potential for earnings surprise.
Ultimately it all comes down to one thing - fundamentals drive equity returns in the long run. Earnings growth is important, but earnings surprise is eminent.
Disclaimer
This document is for informational purposes only and does not constitute investment research or financial analysis relating to transactions in financial instruments as per MIF Directive (2014/65/EU), nor does it constitute on the part of AXA Investment Managers or its affiliated companies an offer to buy or sell any investments , products or services, and should not be considered as solicitation or investment, legal or tax advice, a recommendation for an investment strategy or a personalised recommendation to buy or sell securities.
Due to its simplification, this document is partial and opinions, estimates and forecasts herein are subjective and subject to change without notice. There is no guarantee forecasts made will come to pass. Data, figures, declarations, analysis, predictions and other information in this document is provided based on our state of knowledge at the time of creation of this document. Whilst every care is taken, no representation or warranty (including liability towards third parties), express or implied, is made as to the accuracy, reliability or completeness of the information contained herein. Reliance upon information in this material is at the sole discretion of the recipient. This material does not contain sufficient information to support an investment decision.
Neither MSCI nor any other party involved in or related to compiling, computing or creating the MSCI data makes any express or implied warranties or representations with respect to such data (or the results to be obtained by the use thereof), and all such parties hereby expressly disclaim all warranties of originality, accuracy, completeness, merchantability or fitness for a particular purpose with respect to any of such data. Without limiting any of the foregoing, in no event shall MSCI, any of its affiliates or any third party involved in or related to compiling, computing or creating the data have any liability for any direct, indirect, special, punitive, consequential or any other damages (including lost profits) even if notified of the possibility of such damages. No further distribution or dissemination of the MSCI data is permitted without MSCI’s express written consent.
Issued in the UK by AXA Investment Managers UK Limited, which is authorised and regulated by the Financial Conduct Authority in the UK. Registered in England and Wales No: 01431068. Registered Office: 22 Bishopsgate London EC2N 4BQ
In other jurisdictions, this document is issued by AXA Investment Managers SA’s affiliates in those countries.
Image source: Getty Images